Rapid Query
Overview
Support C-Level executives and managers of a company to access and visualize key information and data whenever they need it.
Develop a helpful tool allowing quick searches and easy access to the most relevant information.
The Problem
C-Level executives and other key members of the organization (managers at different levels) are not always able to access to key information at the moment they need. In some cases, multiple teams and data sources are needed to create aggregated reports for a global view.
The KPIs reviewed or evaluated are usually the same but it’s mandatory to have updated information at hand.
Some C-Level executives and other managers work outside of the office and having access to the latest data allow them to make informed decisions.
Lack of updated information
Not a centralized source of data. A lot of manual work required to pull specific values or reports.
Lack of access to metrics and KPIs
Making decisions when people work outside the office is extremely difficult due to the lack of access to data.

The Challenge
The main challenge is to support people who are very busy in their day to day and also not always have access to their computer or are always available to request reports or key data in the office.
Improving the process, reducing the time and complexity needed to gather and visualize the information.
At the moment, obtaining key reports is limited to specific people or needs to be requested to the relevant department in advance. The reports need to be customized depending on the audience.
Understand the Problem
Research
User Journeys and Navigation Flows
Ideation and Sketch the Solution
Mockups and Interactive Prototypes
Usability Testing
The Process
To solve this challenge, the initial step was to perform field research to understand the needs and pain points of the users.
Based on the research insights, I established and crafted the Personas to visualize the different needs in the right context.
I conducted interviews with people who have different roles in the company to define user journeys and potential improvements that the solution should consider.
Learning about the day-to-day of C-Level executives and managers allowed the exploration of different possibilities to solve the challenge.
User Research
Understanding the different needs of the users
- Interview Users
- Define Personas
- Establish User Journeys
- Understand pain points
Ideation
Sketch, Design and Prototype
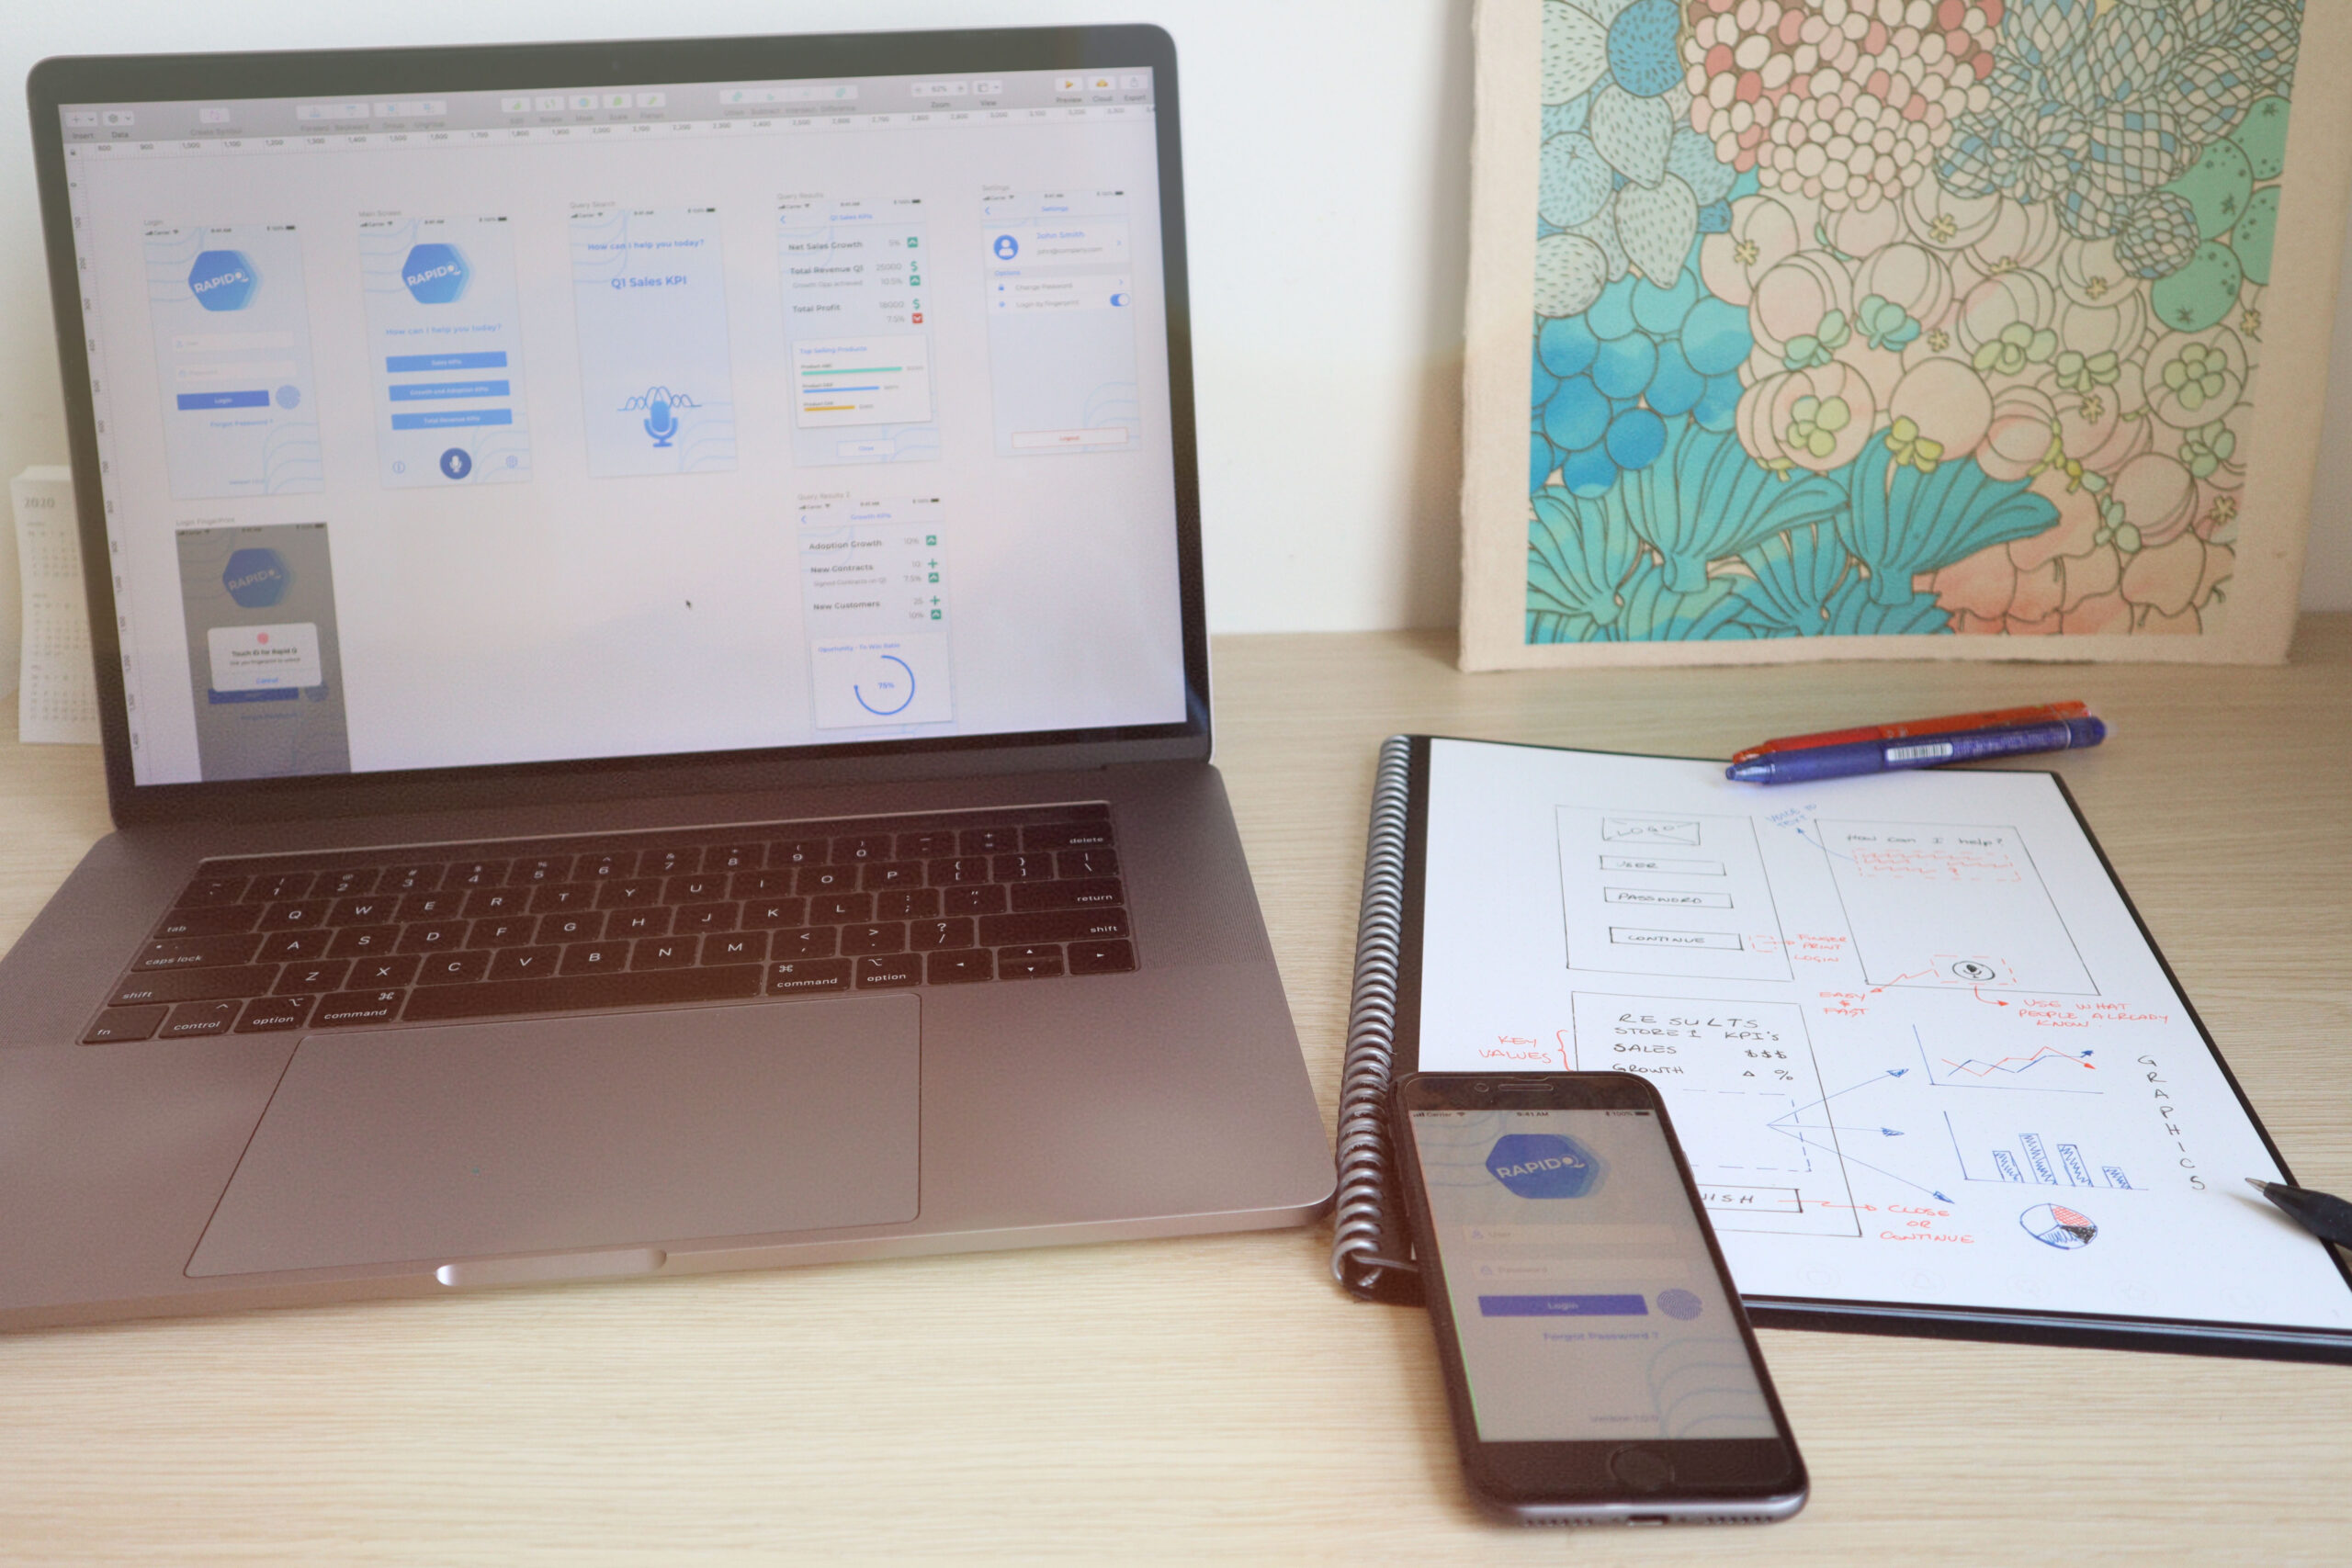
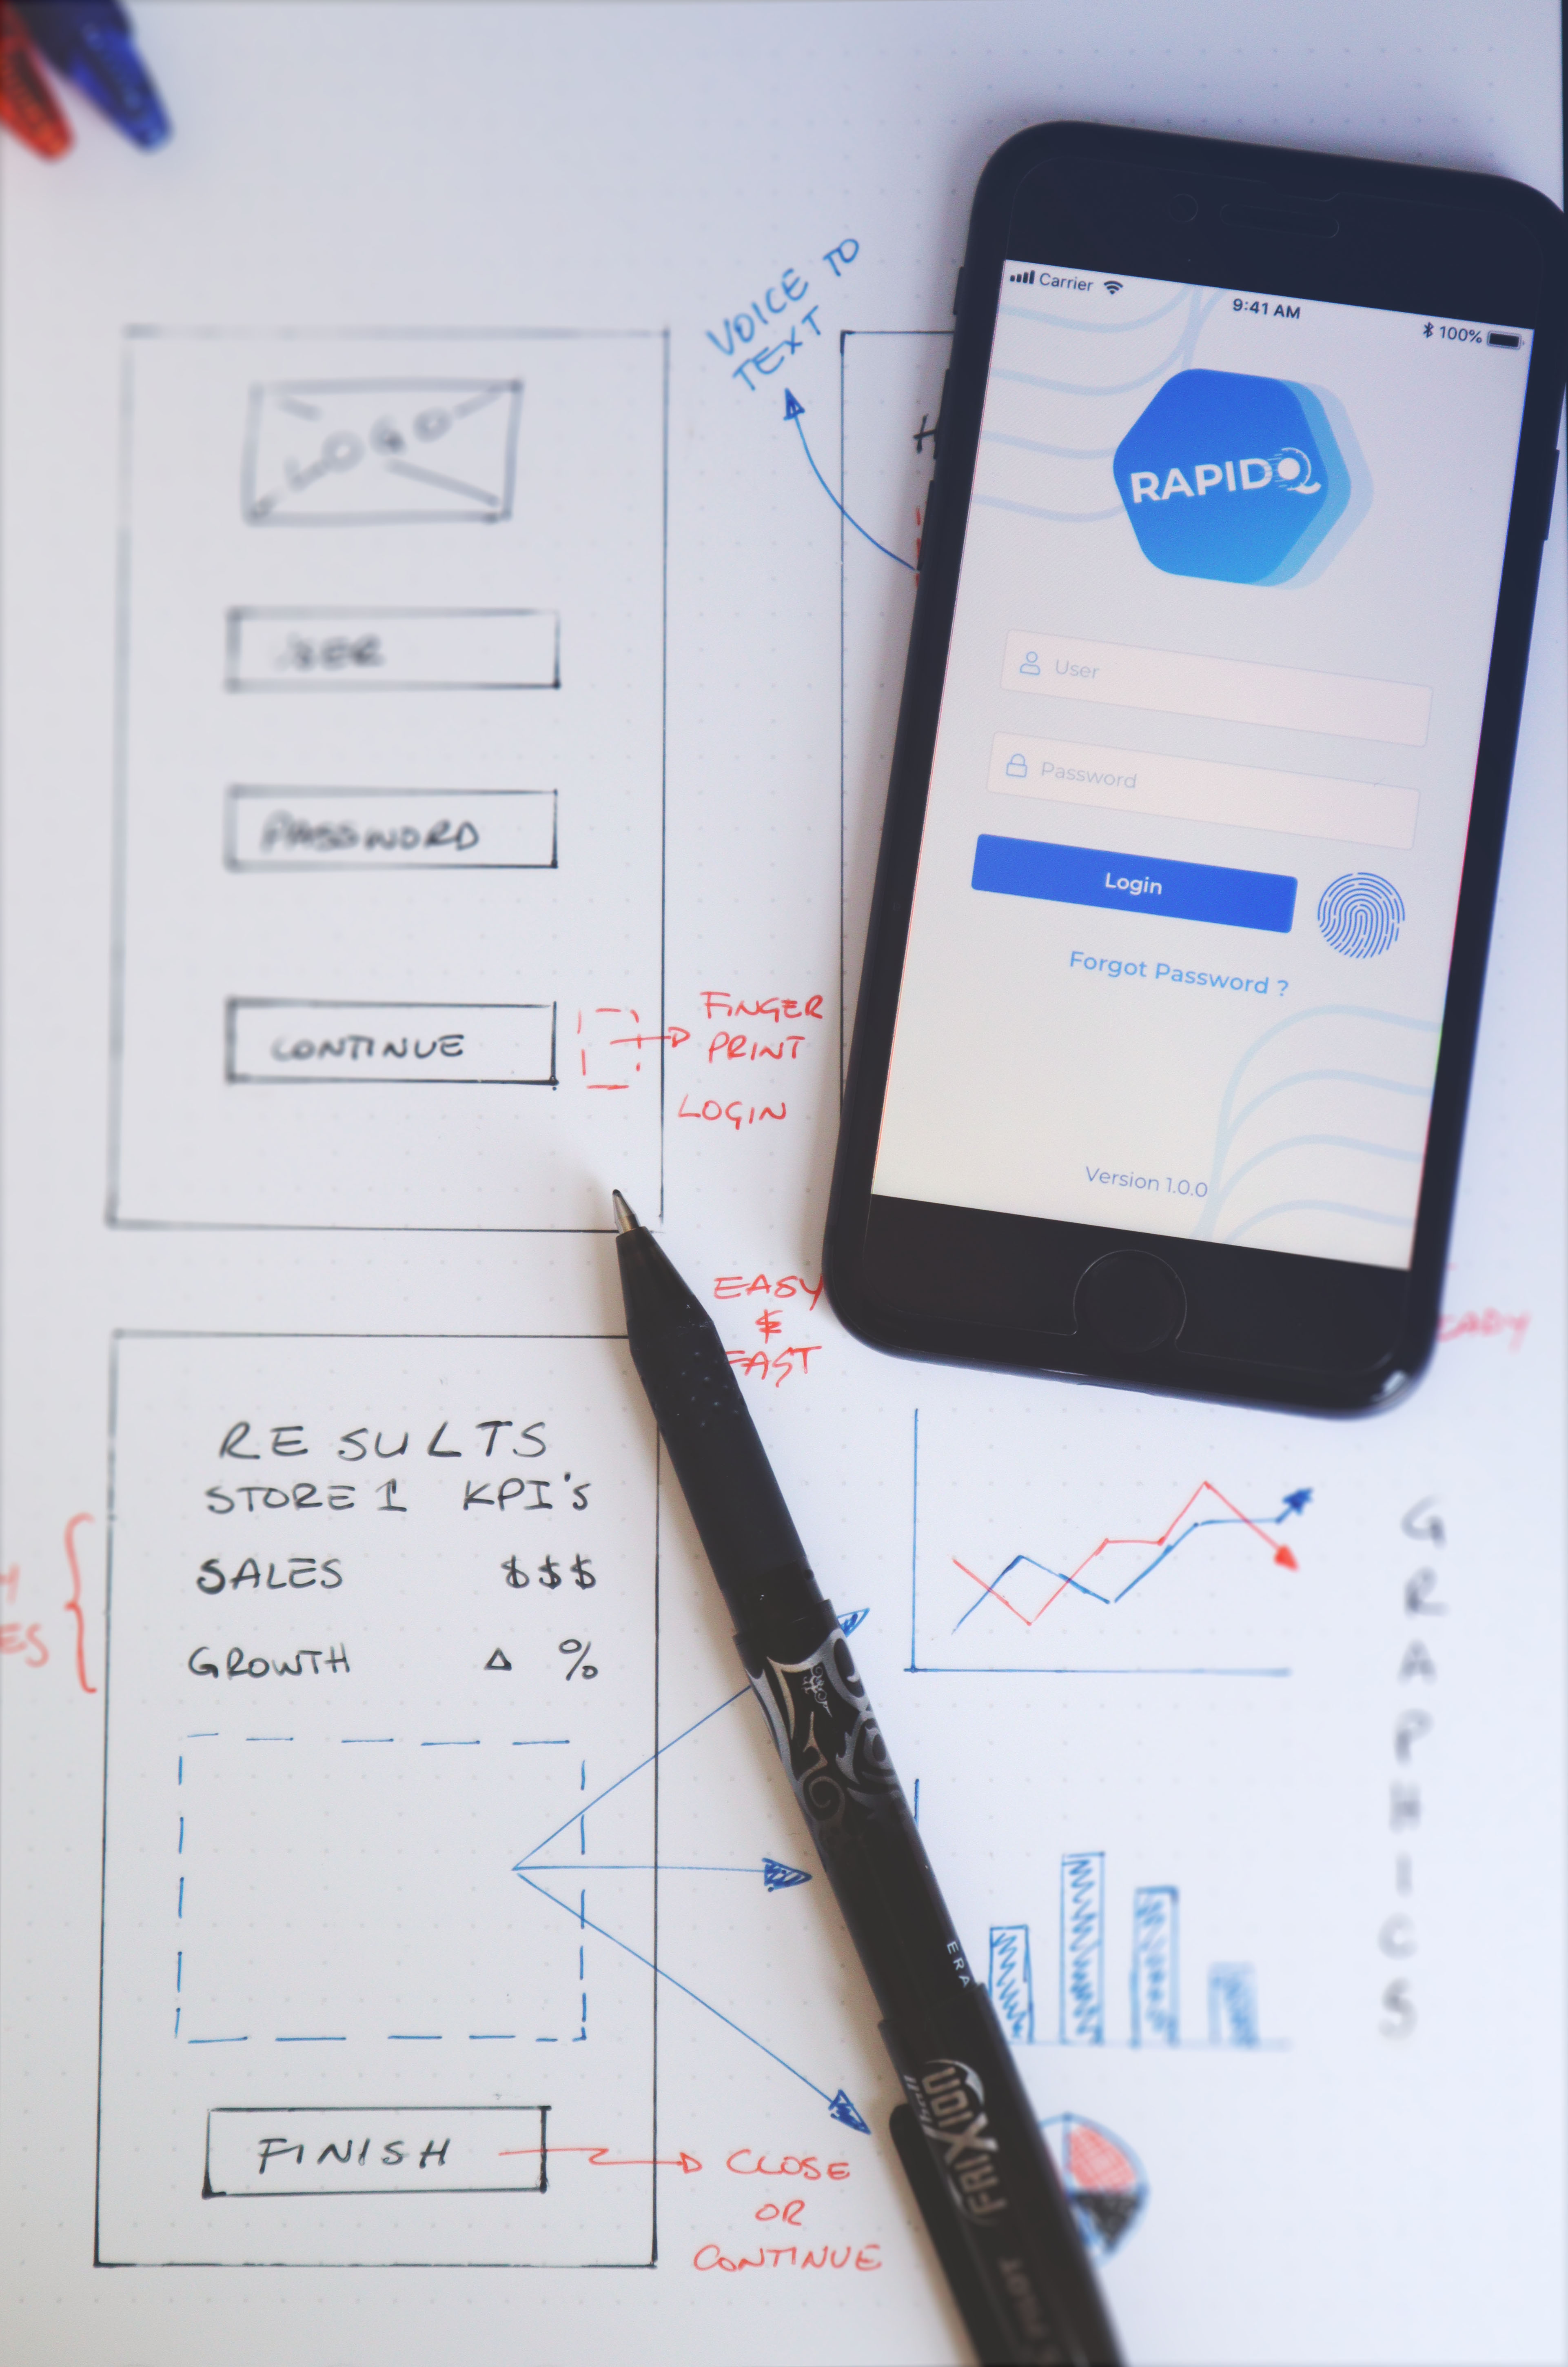
- Sketches and paper prototype early solution ideas
- Proposals for the main navigation flow
- Interactive prototypes for the usability testing sessions
Validation
Test the different explorations
- Multiple sessions with users to validate the proposals
- Test assumptions and define improvements
- Gather feedback and inputs for the next iterations
The Solution
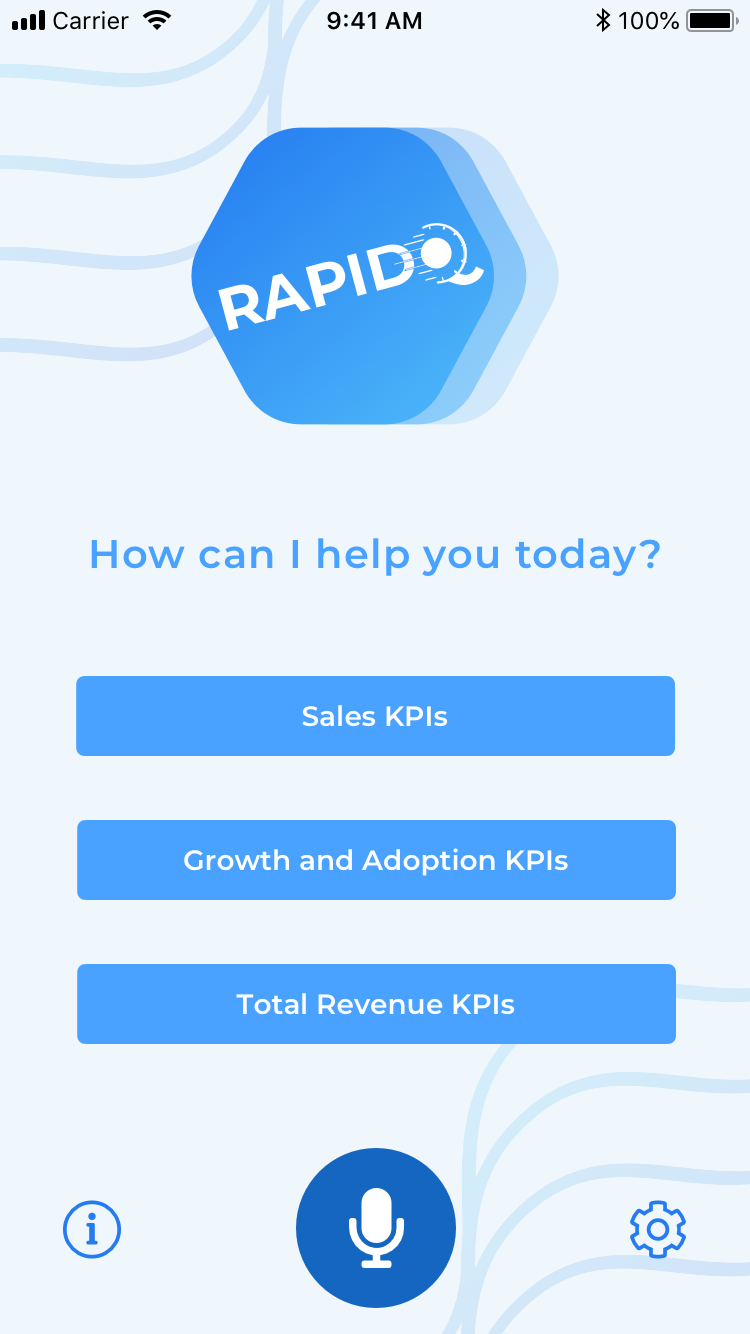
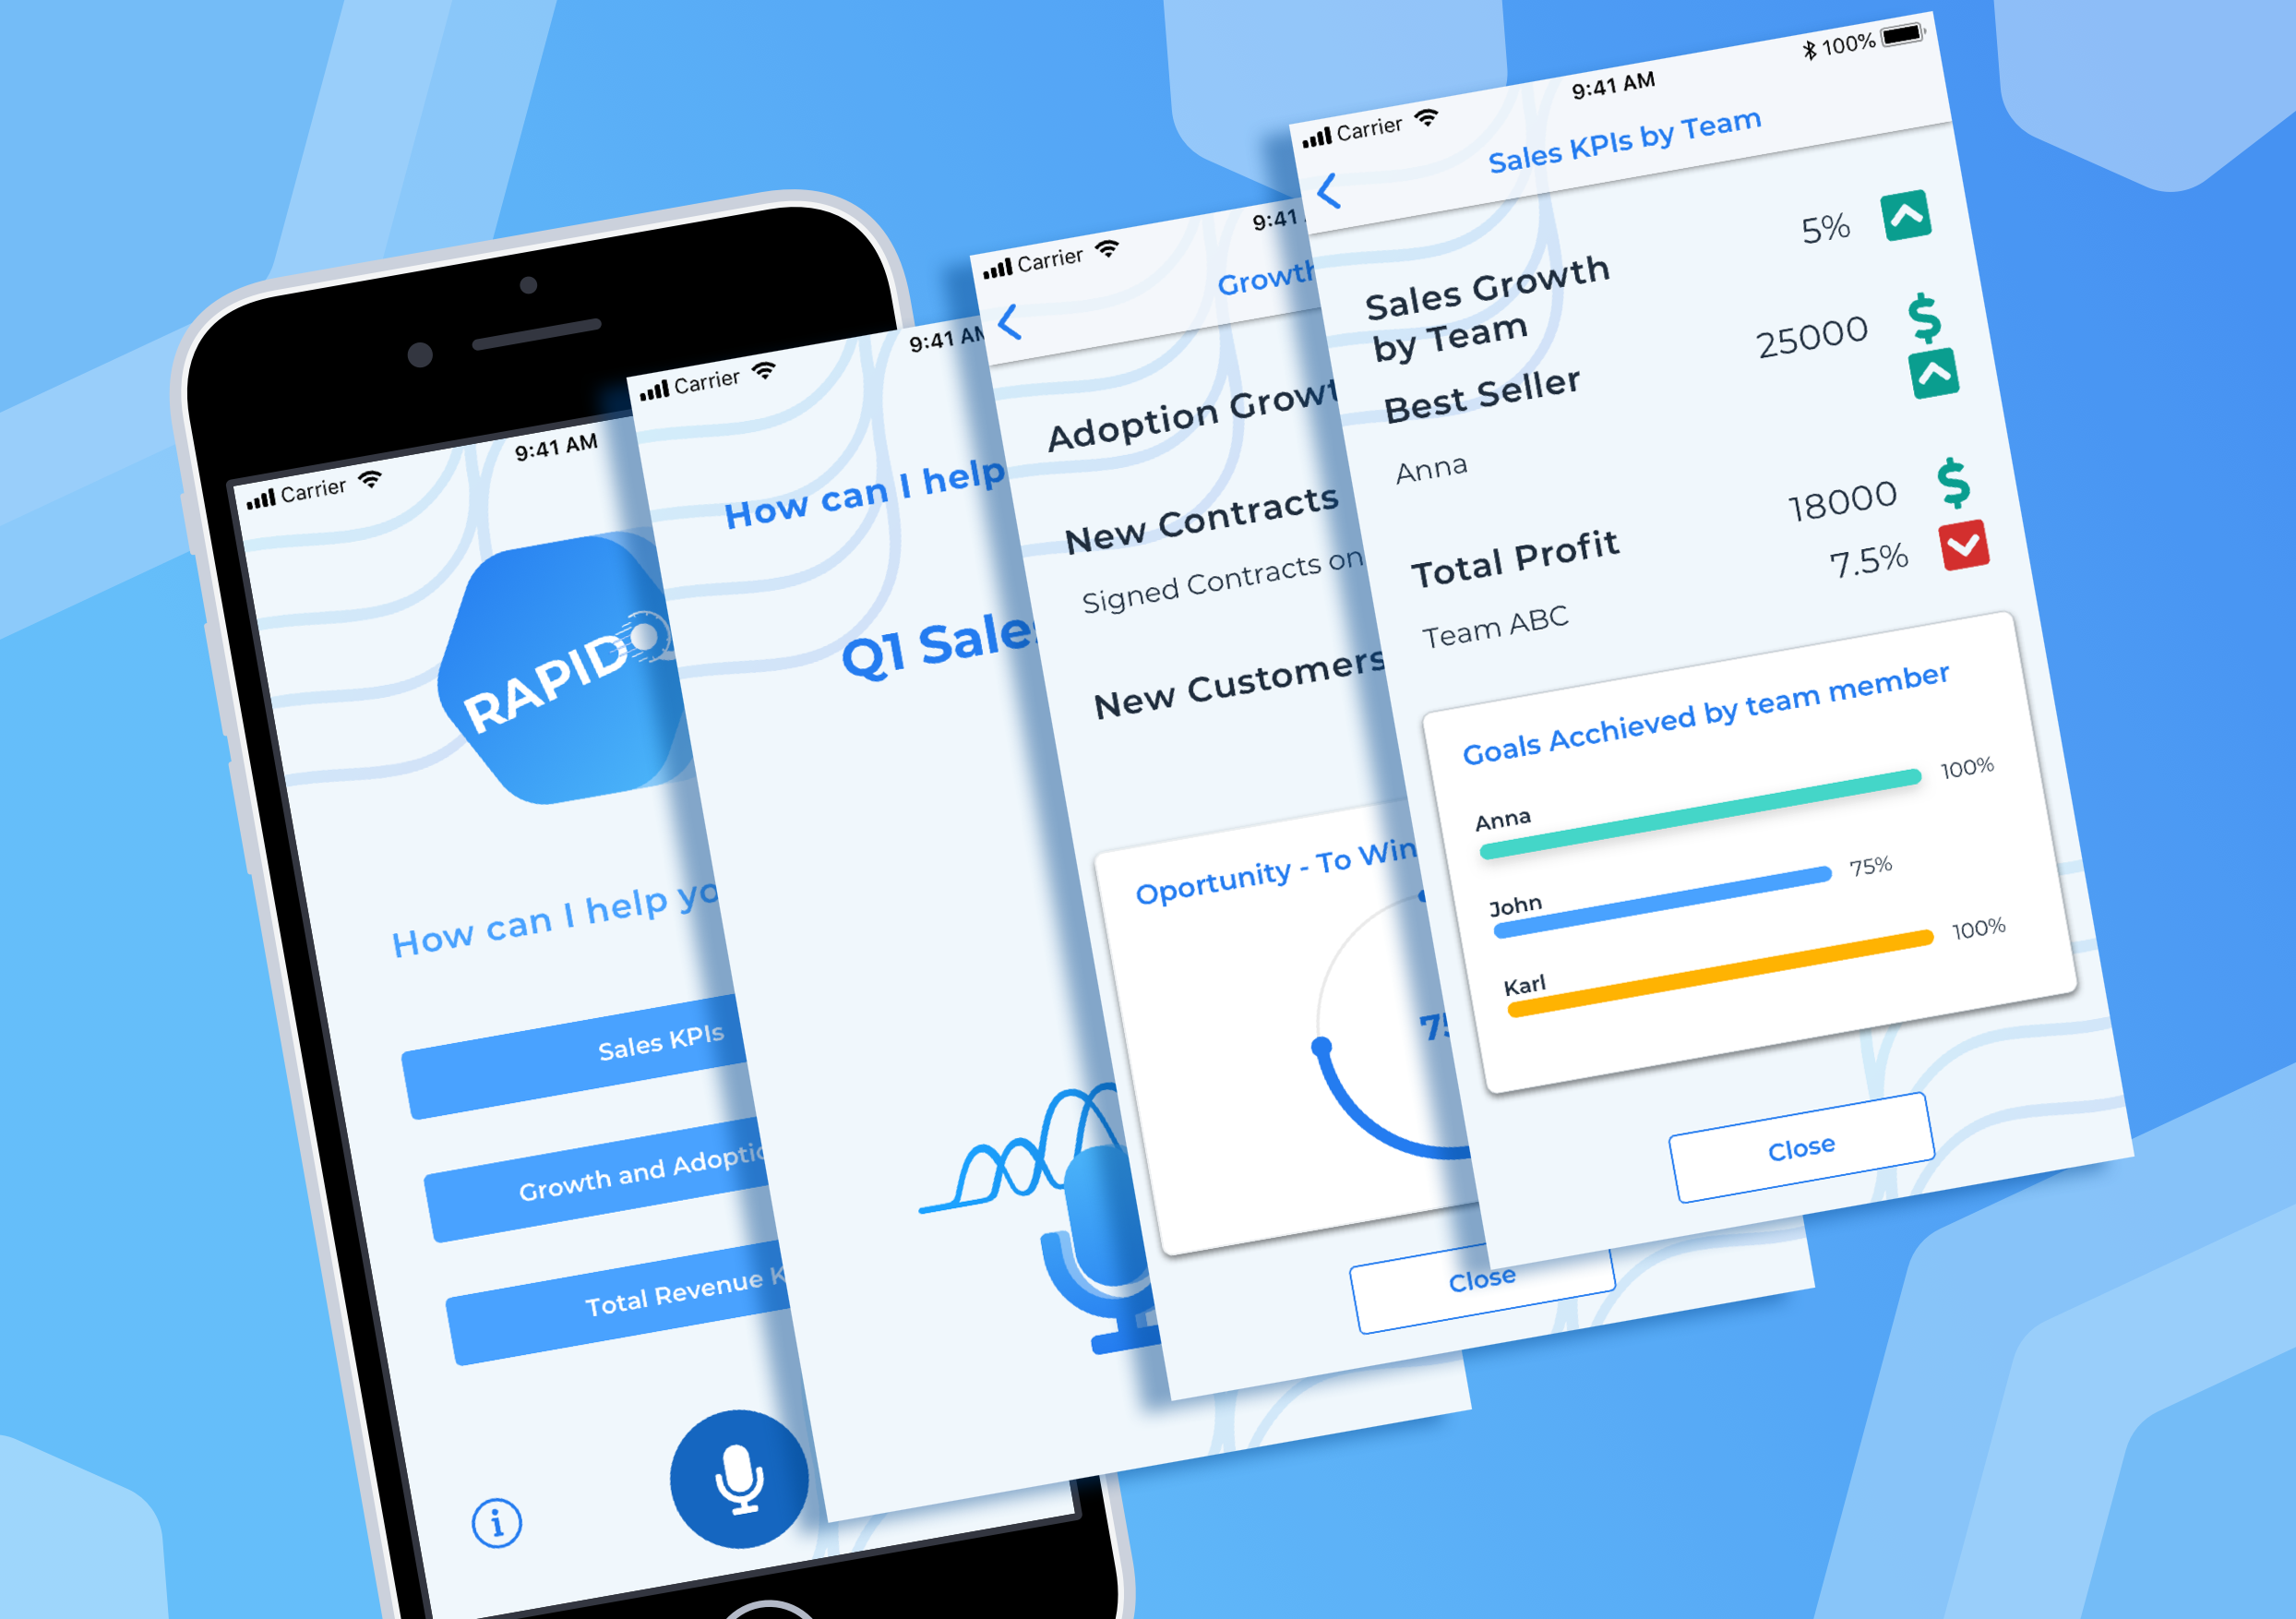
Leverage on existing technology, devices, and information to provide the company executives with a mobile app that allows them to visualize key KPI’s and important aggregated information on the palm of their hands.
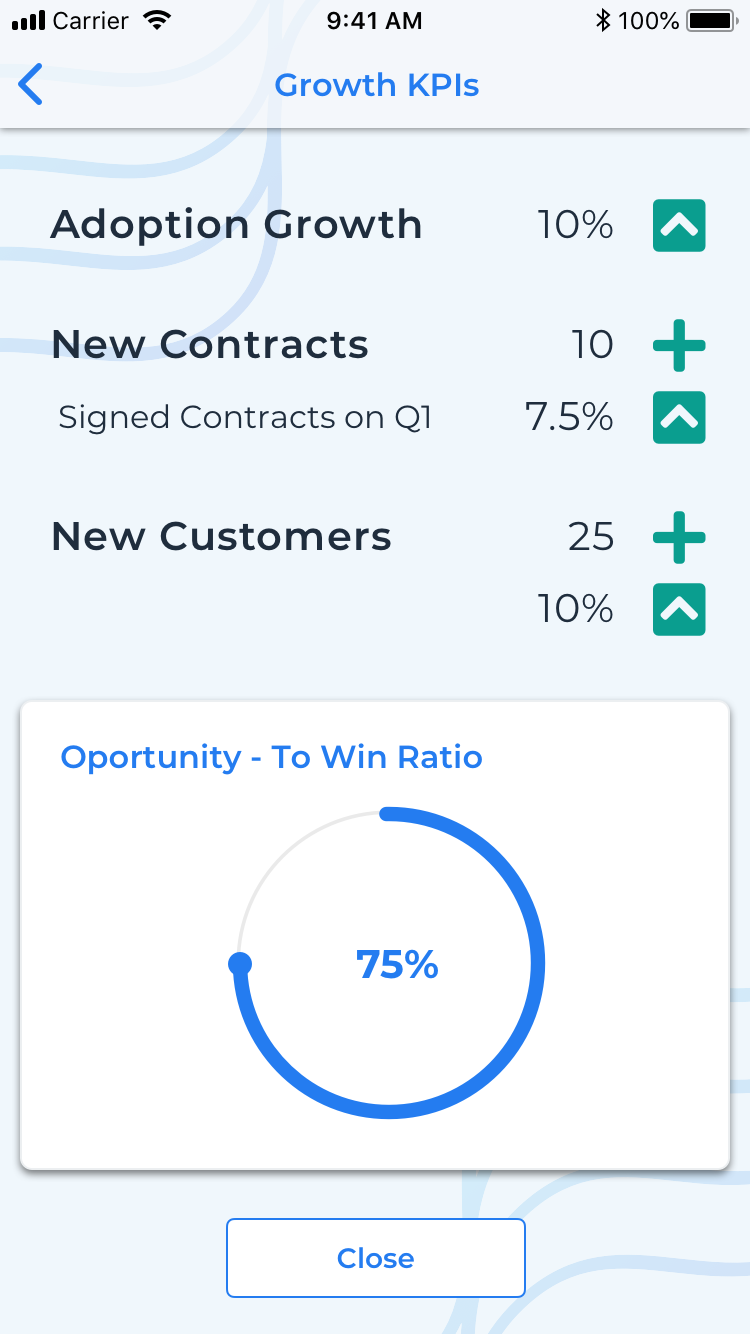
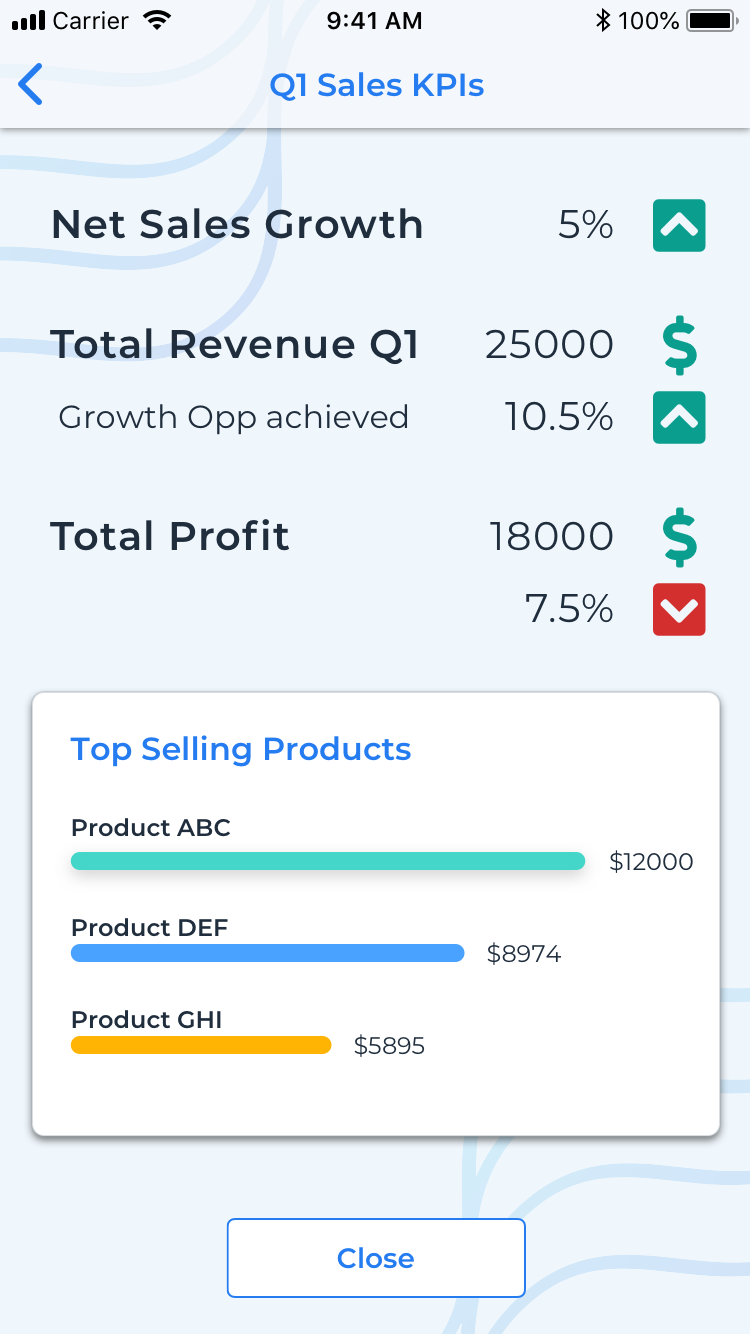
Based on the most frequent requests and questions, a set of pre-processed reports is pulled, increasing the response speed, and simplifying the access to relevant data.
Voice Activated
Ask the most used KPIs or metrics for the organization and get the reports directly.
Data Visualization
Obtain comprehensive reports with visual cues for better understanding
Be Always Ready
Access to the most relevant information all the time.
Informed Decisions
Access to summarized reports and be informed about sudden changes.

My role in the project
UI and UX Designer
Design Strategy
Define the design strategy and support ideation sessions.

User Research
Conduct interviews with users to gather qualitative information
UI Design
Create the visual specs and conceptualize the solution
UX Deliverables
Mockups and interactive prototypes with finalized UI design

Usability Testing
Conduct usability testing sessions
Gather feedback from the users
